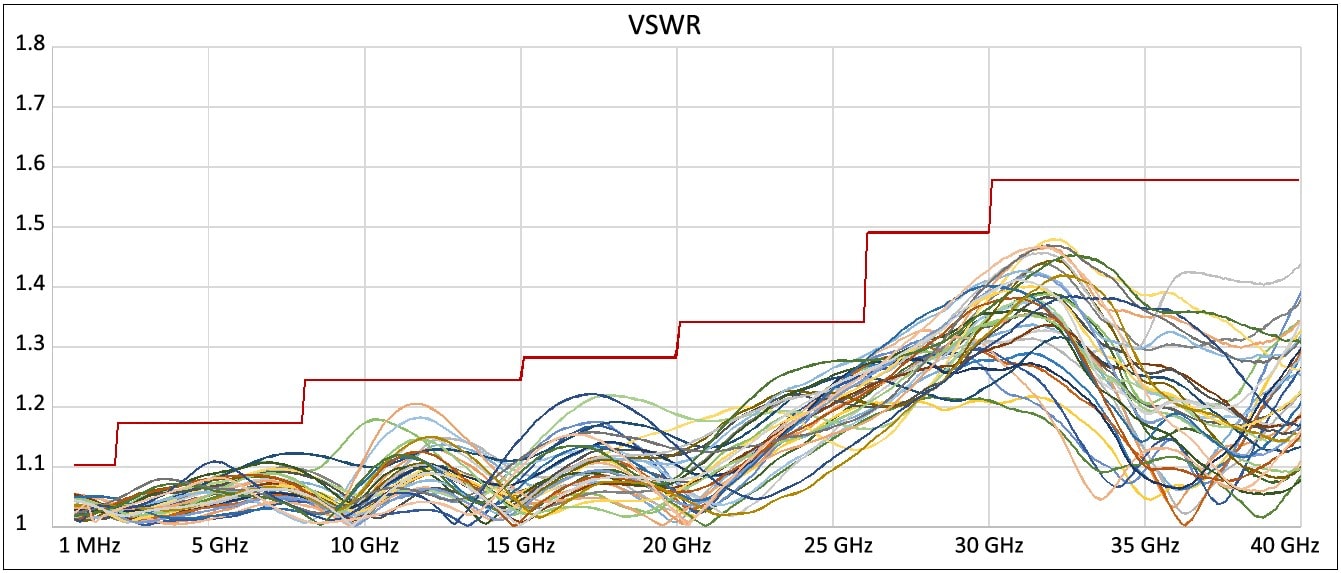
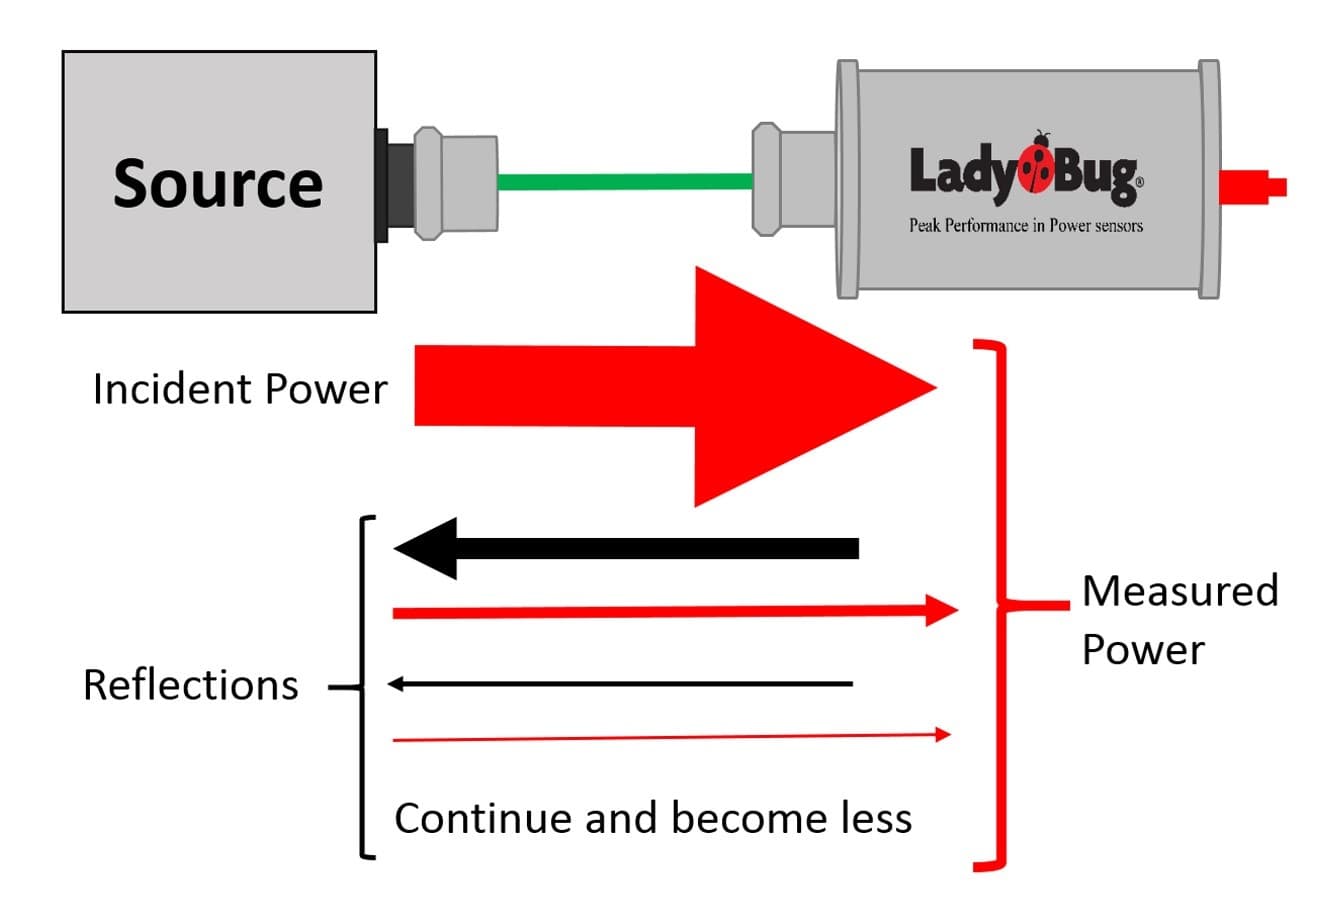
To calculate the potential error, you must know the reflection coefficient (ρ) of the sensor and the source (DUT – device under test). The sensor’s ρ can easily be calculated from its specifications. All calculations are done with linear data. We’ll calculate here based on a VSWR of 1.10 to keep things simple. For this example, we will consider these to be limit specifications (worst case numbers).
ρsens = (VSWR-1)/(VSWR+1)
ρsens = (1.10-1)/(1.10+1) = 0.048 = 4.8%
This worst case number indicates that 4.8% of the power could be reflected back. During calibration, match is mitigated in the applied power system so that the sensor can be calibrated correctly. All power is measured, including that which was reflected back.
Now let’s do the same for a source. Here we will use 1.3 VSWR which is something that we might expect to see.
ρDUT = (VSWR-1)/(VSWR+1)
ρDUT = (1.3-1)/(1.3+1) = 0.1304 = 13.04%
If the above described source and sensor are directly connected there will be interaction due to the reflected power. Let’s calculate the mismatch interaction and total potential error due to mismatch using the formula:
Mm = (1+(ρsens * ρDUT))2-1
Mm = (1+(.048*.1304))2-1 = 0.0126 = 1.26%
The potential error in measurement due to mismatch is 1.26%. Since limit values (worst case specifications) were used, the error would be something less than this. If we had located and used typical numbers, we would have had a smaller number that was probably more accurate instead of this worst case result.
If we now consider a different power sensor which has a similar but not exact VSWR we will see slightly different results even if the calibrations are both perfect.
This second sensor has a VSWR of 1.11, just slightly different than the first.
ρsens = (VSWR-1)/(VSWR+1)
ρsens = (1.11-1)/(1.11+1) = 0.052 = 5.2%
The worst case number for the second sensors shows that 5.2% of the power could be reflected back from the sensor.
Since there is no change in the source, we can use ρDUT of 0.1304 and calculate the combined result as:
Mm = (1+(ρsens * ρDUT))2-1
Mm = (1+(0.052*0.1304))2-1 = 0.0136 = 1.36%
The potential error in this measurement due to mismatch is 1.36%, very close to the former 1.26%. However you can not expect both sensors to measure exactly the same even though both are good measurements.
As can be seen, even if you have the very highest level of calibration, match can cause significant measurement uncertainty. Mismatch is generally considered the most significant part of total measurement uncertainty.
In cases where high source mismatch is present, uncertainty can be reduced by adding an attenuator to the system. If, for example, a 3 dB attenuator is inserted between the source and sensor, the returned power from the sensor to the DUT is reduced, then the resultant reflection back from the DUT is again reduced, minimizing the error. Additional reflections are added on each side of the attenuator, however in cases where large source mismatch presents an issue, these attenuator mismatch errors are generally small in comparison to the larger source mismatch. Users requiring the highest level of accuracy should take all factors into account.
While mismatch is usually the most significant component of a measurement’s uncertainty it is only one of many. Another component is the sensors Calibration Factor uncertainty. This important uncertainty represents the accuracy of the sensors calibration, and is often stated by manufacturers as the sensors accuracy because the DUT mismatch is unknown. However sensor-to-DUT mismatch is most often a more significant uncertainty.
An easy way to begin calculating measurement uncertainty and increase your overall measurement accuracy and understanding, is to workup the uncertainty of a measurement using a power sensor manufacturer’s uncertainty worksheet or spreadsheet. For example, the last pages of the above mentioned LB5940A power sensor’s datasheet includes a work sheet and completed example that covers the most significant factors in a typical power sensor measurement. Most high quality power sensor manufacturers provide similar worksheets.
A power sensor manufacturer can supply specifications, however it is not possible to determine the accuracy of any measurement without knowing the measurements parameters. Most of the specifications have an associated parameter such as frequency or power level. These will determine which specification from the sensors data sheet are applicable. Once these are all known, they can be included in an RSS calculation to determine the total measurement uncertainty.
In conclusion, for the best accuracy, make the distinction between sensor accuracy and measurement accuracy, then use the sensor’s specifications to develop a full understanding of your measurement’s uncertainty. This will give you confidence in the measurement and allow you to improve the accuracy as needed.


