Today’s modern USB Power Sensors are capable of many advanced power measurements. These Power Sensors are capable of demodulating the signal and processing the video information into usable measurements.

Statistical pulse measurement capability is just one of the many features these new power sensors can deliver to the engineer at a modest cost. This article will discuss the benefits and explain the methodology used to make statistical pulse measurements in two state pulse waveforms. Its purpose is to explain to the power sensor user the methodology in making the measurements so that the user can make better measurements with confidence.

Pulse measurements are usually made by one of three methods. The first and simplest method begins by measuring average power. Once the average power is known, the user calculates pulse power from an assumed duty cycle. This simple time-tested method is relatively inexpensive; however it relies on an assumed duty cycle which can add error into the measurement.

Graphical analysis is another method that is commonly used. Here, the user or software process acquires, parses and analyzes a time domain representation of the signal. This requires more expensive equipment and additional training. Data analysis can be slower and relies on triggering which can make acquisition difficult. Its greatest value is being able to directly viewing the signal.

The last method and the subject of this article is statistical analysis in which samples are taken over a period of time and then analyzed. This method collects more data, and can provide better accuracy. This method can produce repeatable accurate results, and requires less training. It is also cost effective. This approach is usually less reliant on skill or assumptions than the first two methods.

Download this Whitepaper: About Statistical Measurements

While currently and in the past, this method has been employed heavily on radar pulses, it can also provide significant value on today’s communication signals. Size and weight reduction in PA (Power Amp) circuits for portable devices is a challenge. Statistical measurements can be utilized to directly measure important signal parameters. These tests can help the engineer confirm device specifications and optimize data density on signals with complex modulation without exceeding component design specifications. Statistical pulse measurements excel in this area and can be used to verify an engineer’s design and test for component failures. A gated measurement can be made on an actual data borne signal with non-repetitive pulse shapes and the statistical measurement will accurately report crest factor and other parameters.

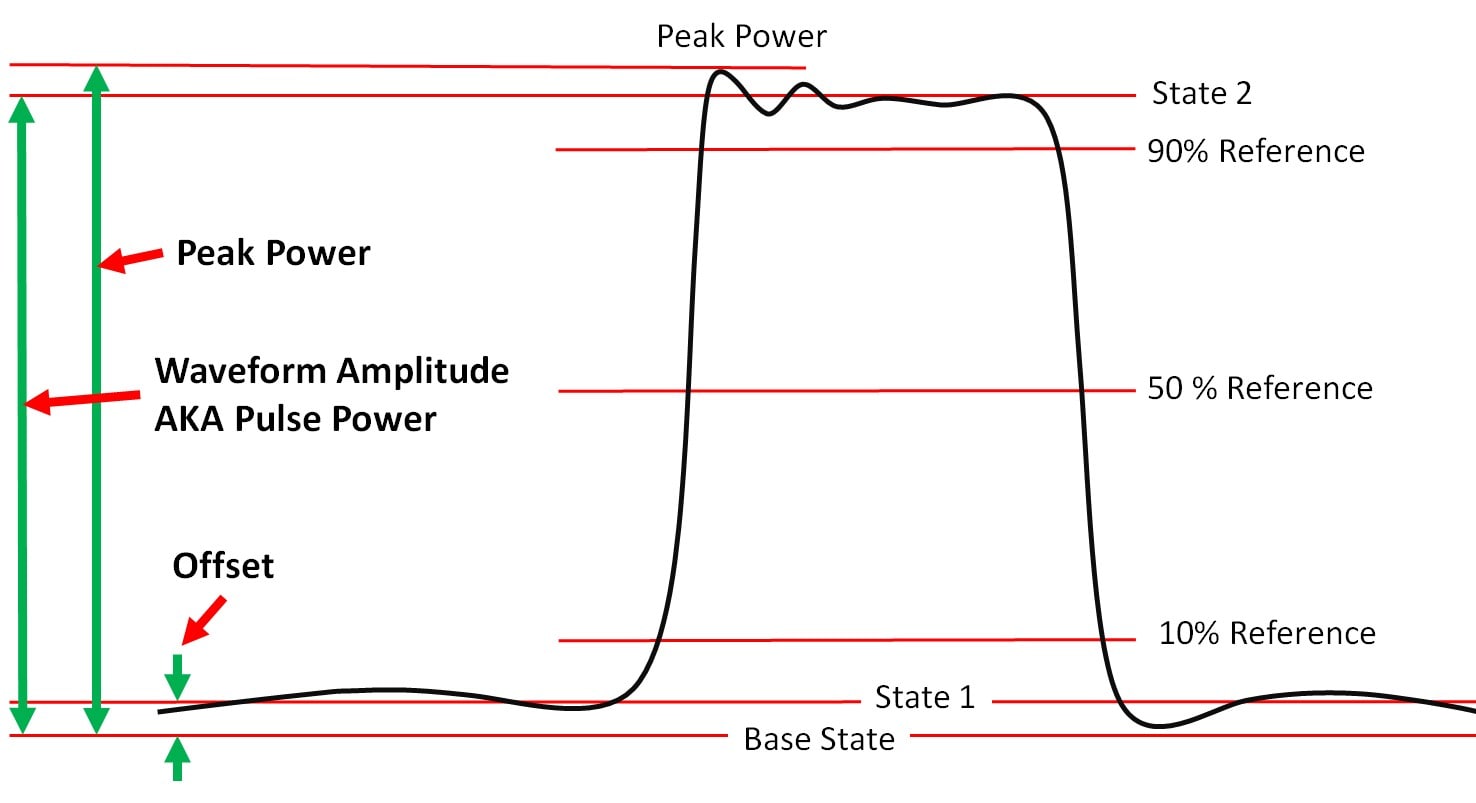
To explain how measurements are made, pulse parameters must first be specified. In this article, pulse definitions from IEEE Standard 181-2011 will be utilized. This specification defines all necessary pulse parameters in detail. Only a portion of the defined parameters will be used in this paper, further, an added parameter, Peak Power, will be specified. Refer to Figure 1, Pulse Amplitude Specifications along with the following explanation.

Figure 1 – Pulse Amplitude Specifications

Pulse Specifications

This article used IEEE Standards 194-1977, 181-1977, 181-2003 and 181-2011. With revisions of these standards, some traditional terminology has been deprecated and or replaced. The statistical measurement principles discussed here remain essentially the same. The table below lists the important terminology changes utilized in this article. Descriptions listed for these terms may vary, for example 10% and 90% are not always used as the reference points. Some of these deprecated terms are in use in the industry and may be referenced here along with the new terminology. See Table 1 for a list of some of the new terms along with the deprecated terms.

Deprecated Term

New Term

Description

Duty Cycle Duty Factor The ratio of the pulse duration to the waveform period
Rise Time and Fall Time Transition Interval Unless otherwise specified, based on the 10% and 90% reference levels. Note: First Transition formerly known as Rise Time. Second Transition as Fall Time.
Magnitude Origin Base State Roughly, zero power reference.
Base Magnitude State 1 The lowest State Level
Top Magnitude State 2 The highest State Level in a two state waveform. The average of the Pulse Top. AKA Pulse Power.
Pulse Amplitude Waveform Amplitude The difference between State 2 and State 1. (Magnitude less Offset).
Line State EX: Base Line is now State 1.
Proximal 10% Reference Power Leve Referenced between State 1 and State 2
Mesial 50% Reference Power Level Referenced between State 1 and State 2
Distal 90% Reference Power Level Referenced between State 1 and State 2
Pulse Width Pulse Duration The pulse active time; time between the 50% References
Droop Tilt Slope Distortion

Table 1- Terminology

Referring to Figure 1, Peak Power is added and is not generally referenced in the IEEE Standards. This is usually the first overshoot. The LB479A power sensor used in this article reports this measurement.

State 2 or Top Magnitude Power is often referred to as Pulse Power or Pulse Top Power, and will be referenced as Pulse Power in this document. Occasionally, this measurement is confused with Peak Power; however they are very different. The Power Sensor user should make sure they fully understand their sensor’s measurement. This is an important measurement, often needed by engineers designing PA circuits which operate at or very near specific limits.

The bisecting points of the 10%, 50% and 90% References are used to locate time related information such as Transition Durations (Rise and Fall Times), Pulse Duration (Pulse Width) etc. Only the 50% Reference will be utilized here. This point is defined as the 50% of the State 2 Power, and may also be referred to as the 3dB down point by some users.

The Base State represents no power, and is often equated to the noise floor on a typical Power Sensor such as the LB479A used in this paper. With this sensor this level is well below -60 dBm. Base State is the minimum power the system can measure. In some instances, such as the case where a switch with leakage is implemented for pulse generation, the State 1 will represent the presence of power as is indicated in Figure 1; this power is referred to as Offset Power. A typical Power Sensor will represent State 2 Power and Peak Power as absolute power (measured from the Base State), since that is the measurement of interest in most cases. Any Base State Power will simply be included in the average power measurement.

Using the above Pulse definitions, let’s look at how the specific measurements can be made. The statistical measurements discussed here are done without consideration to pulse timing information, and will not provide Pulse Duration or Pulse Period; however Duty Factor measurements will be made. The only two time considerations are 1.) The digitized samples should be taken on a consistent repetitive time basis so that there is the same amount of time between samples. Of course sufficient bandwidth and sampling rate for the given waveform must be available, and 2). The waveform epoch (entire period of time that samples are taken within) is sufficient to collect all required signal information, more on this later.

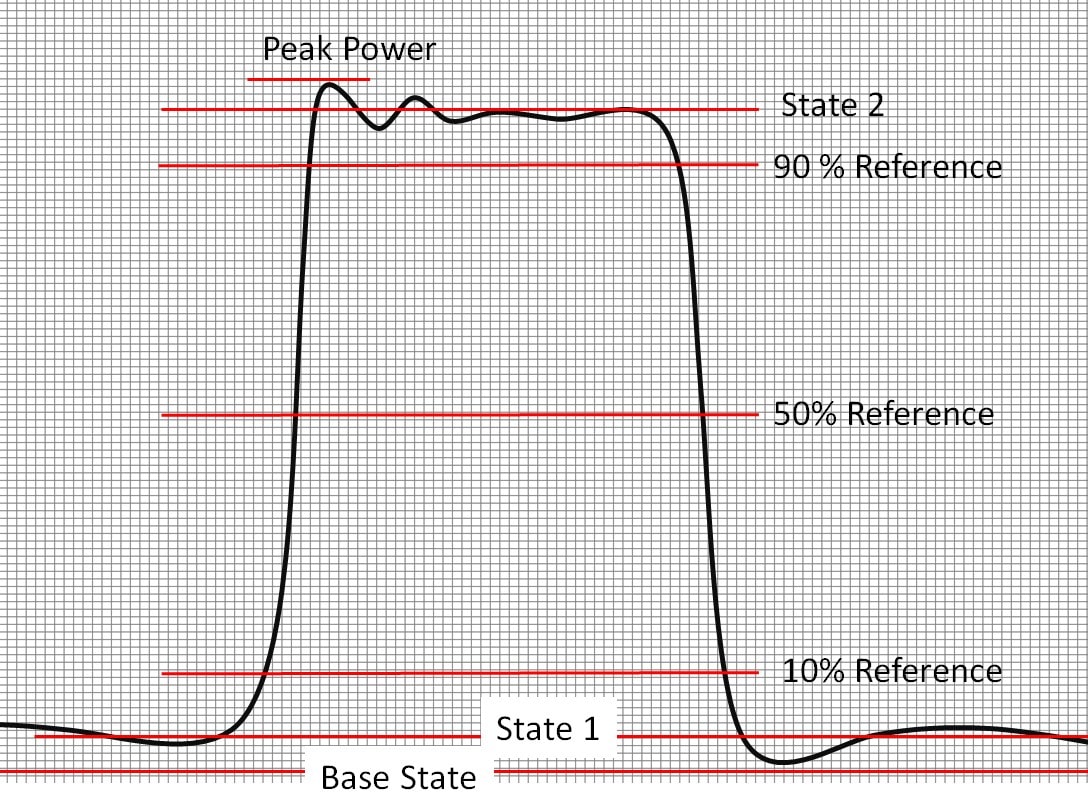
Figure 2 – Pulse with Grid

To make Statistical Pulse measurements samples are taken repetitively in accordance with their power level. Referring to Figure 2, this can be visualized by laying the pulse over a sheet of graph paper with the X axis representing point a sample is taken, and the Y axis representing its power level. Note that the Y axis is limited to the measurement power level capability while the X axis is only limited by the number of samples desired, a very significant number of samples may be taken if necessary. In the graph shown in Figure 2, each vertical line represents the occurrence of a sample, while each horizontal line represents a power level. It should be noted that so long as consistency and associated math rules are utilized, the units can be liner or log.

At this point, it is easy to see the Peak Power. It is simply the highest measured power level.

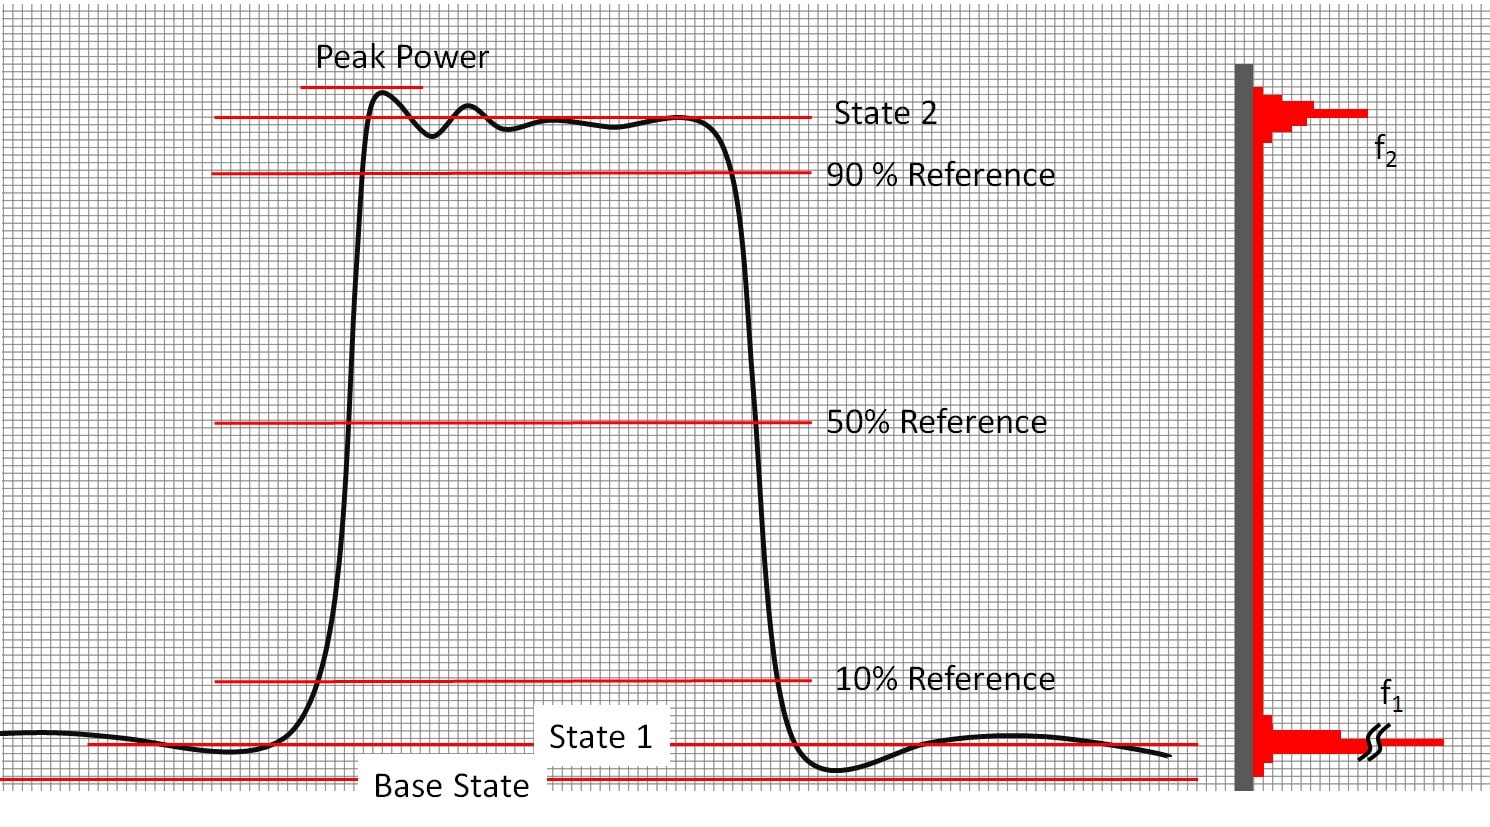
State 2 or Pulse Power, shown in Figure 2, must be calculated and represent an average of the top of the pulse. Here, the IEEE Standards are utilized. One method is to use Mean of Density Distribution. This is a good method for a basic pulse such as the one in the Figures and is suggested in the original standard. Newer standards reduce the graphical explanation of the method. Visualization is utilized here to help explain the process.

Histogram Data

Referring to the graph in Figure 3, note the added histogram data at right. This graph represents the sum of binned samples. As the individual samples are taken across the waveform, each data sample is evaluated, and its associated bin incremented. This “occurrence density distribution” algorithm, develops the shown histogram. Note that the bins do not contain power levels. The contents is the sum of the presence of values within a power level range. For example if a sample value is 5dBm, the 5dBm bin would be incremented. On pulsed waveforms such as the example in the Figures, this method will develop two distinct modes, State 2 (f2) and State 1 (f1). These are noted on the horizontal peaks shown in the histogram at right in Figure 3. Since the pulse has not been repeated in this diagram, and only one pulse is shown with no clarity of the number of samples taken between pulses, f1 is unknown at this point. It (f1), the count of matching power levels could be much larger than shown in cases such as a radar pulse with significant time between pulses.

Figure 3 – Pulse with Grid and Histogram

NOTE: The algorithm may be automatically modified or a different algorithm altogether may be used for distorted pulses or other shapes. The LB479A sensor, for example, employs this and several additional algorithms to evaluate statistical power. For further discussion, refer to the IEEE standards listed earlier.

Average Power

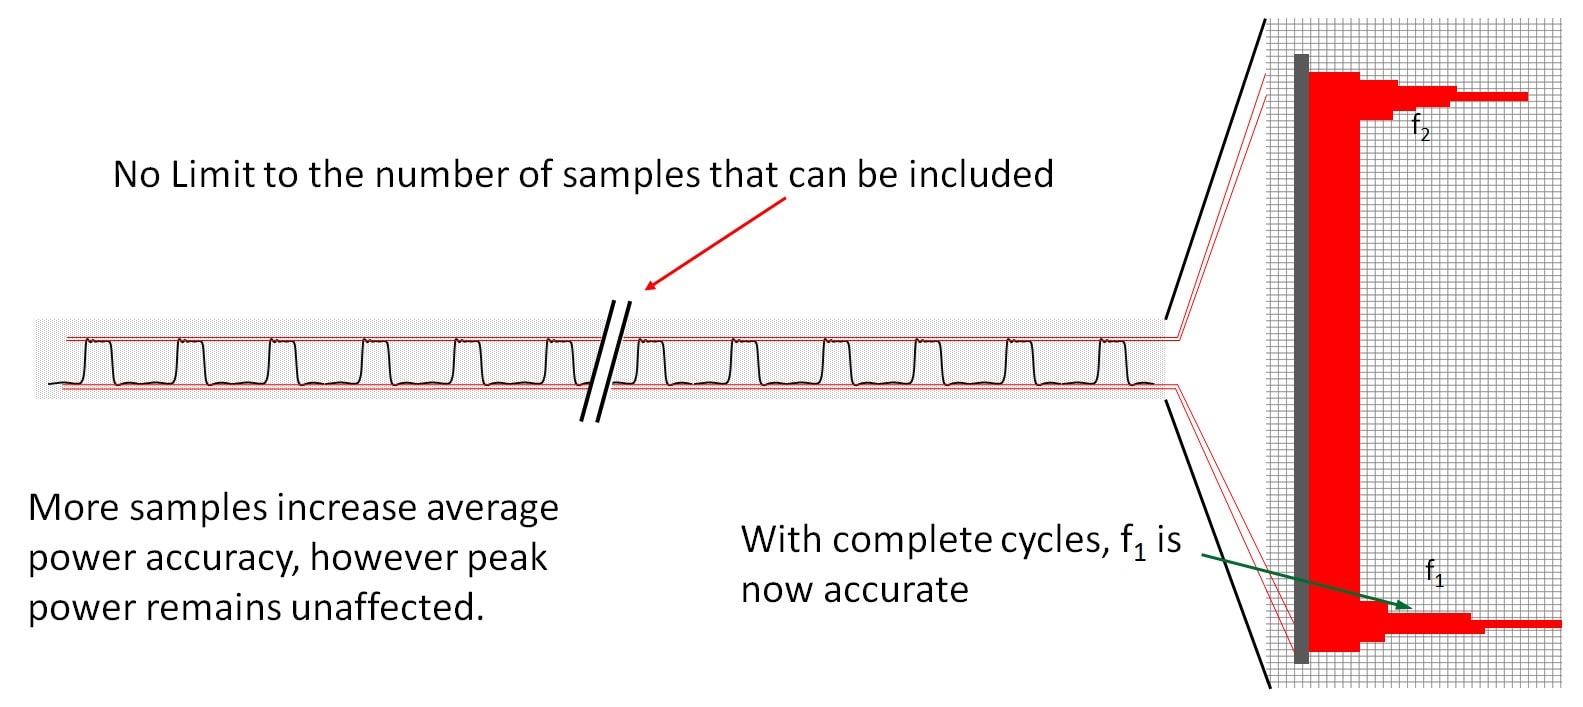
Average Power can be calculated by simply averaging the sampled power levels (converted to linear units if in log). As previously mentioned, the image shown in Figure 3 does not necessarily include a complete wave form, rendering an average of only the data shown inaccurate. This is no different than any typical average power measurement, many samples should be averaged for accuracy and stability. In this case we are examining specific pulses, however the averaging calculations are the same. For statistical measurement work, averaging for extended periods of time (lots of samples) increase the accuracy on all fronts. The pulse stream in Figure 4 shows many pulses, the result is an increase in all of the values in the histogram, resulting in increased accuracy and a good average power measurement. The measurement epoch must include many cycles to minimize error.

Figure 4 – Multiple Cycles with Expanded Histogram

Crest Factor

Once Average Power is known, Crest Factor (CF) can be calculated since Peak Power has already been determined. Crest Factor is normally reported in db. The following formula can be used to calculate Crest Factor if units are linear:

CF(dB) = 10log10 (Peak Power / Average Power)

Pulse Power

Pulse Power can be found by identifying the State 2 Mode (f2). Recall that while each bin contains the number of samples at a specific power level, it does represent a specific power level. Pulse Power is the power represented by the State 2 Mode (f2).

Duty Factor

Duty Factor (Duty Cycle) can be expressed as the percentage of one period in which the signal is active. Here is the basic formula for Duty factor:

DF(%)= A/P * 100

Where DF is the duty Factor, A is the time the signal is active, and P is the total period the result is multiplied by 100 so that it is expressed as a percentage.

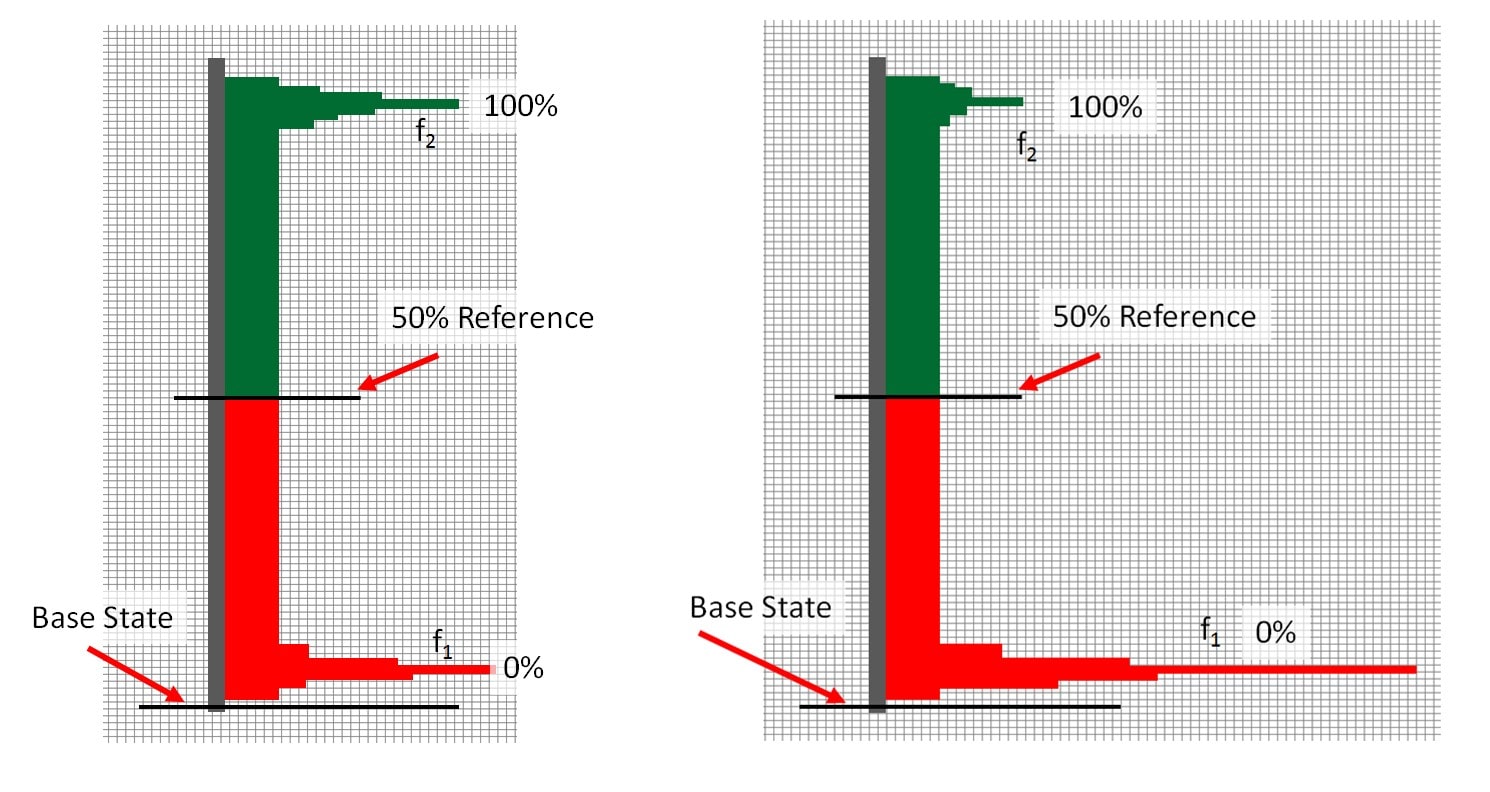
Calculating Duty Factor requires locating the beginning and end of the pulse. This will be done using the 50% References. Refer to Figures 3 and 5. IEEE 181 specifies that the 50% Reference is Base State Power plus 50% of the difference between State 1 and state 2. This calculation removes the out-of-wave Offset Power from the timing calculation making it more accurate; then adds the Offset back in so that Power is expressed from the absolute reference. Refer to Figures 3 and 5. Note that in Figure 5 Left, the data above and below the 50% Reference appears balanced, this is because the pulse has a duty factor that is fairly close to 50%. Figure 5 Right depicts a pulse stream with similar power levels and a somewhat lower Duty Factor. This can be seen by the additional bin volume below the 50% Reference and less above, indicating that the signal was at State 1 (f1) for a longer period of time and State 2(f2) for less time.

Figure 5 – Histograms with Mesial Line

Assuming the power levels have been converted to linear units, the following formula can be utilized to calculate the 50% Reference Power Level.

P50%= Base State + (0.5*(State 2 – State 1))

This Power Level is recognized as the power at the leading and trailing pulse edges. Once this is known, Duty Factor can be calculated. To calculate Duty Factor, we won’t actually use the power level at the 50% Reference because the calculation will be done with bin counts. Since the 50% reference represents the leading and trailing edges of the pulse, all bin counts above the Reference represent time that the Pulse is Active.

Referring to Figures 4 and 5, and the Duty Factor formula above, the total sample count inside the measurement epoch represents the time that that pulses were taken within, and is represented by P. The number of samples taken that lie above the50% Reference represent the Active time and is representative of A. Note that while units of time are referenced with A and P, any such time units cancel out, leaving only the bin count, and the time information is irrelevant to the calculation. The sensor’s sampling rate could be utilized to associate actual time if desired, however it is unnecessary for the calculation of Duty Factor.

For example, if during the measurement window, 1,276,412 samples were taken, and it is determined that 437,567 lie above the 50% Reference, the Duty Factor is:

DF = A/P*100 = 437,567/1,276,412*100 = 34.28%

Actual Measurement

Now let’s see what a real power sensor can give us as a measurement. Using the pulse information and algorithms found in the IEEE specifications, the LB479A sensor makes economically accurate measurements such as those shown below.

Figure 6 shows the pulse measurement using an LB479A power sensor. Note the Pulse Power in the main display and the Peak Power are nearly identical, indicating a pulse with a flat top and little overshoot or tilt (droop). The Duty Cycle is 11.11% and average power is -3.657 dBm. This measurement took very little time to setup and is highly accurate.

Figure 6 – Statistical Pulse Measurement

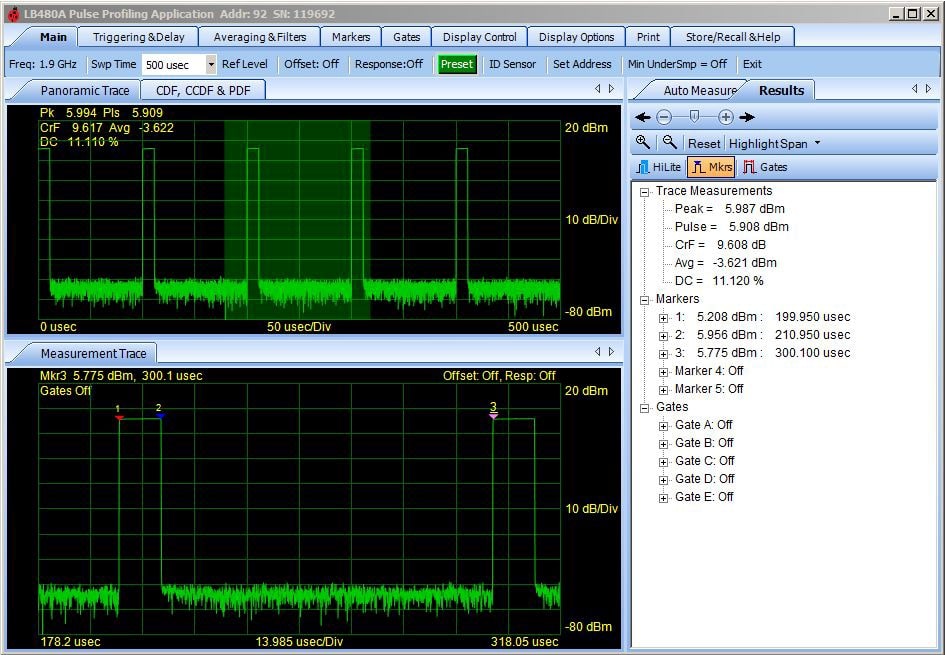
For comparison purposes, the image in Figure 7 was made with an LB480A power sensor with Option 004 on the same pulse stream. The measurement is edge triggered and trace based, plus it includes time related information such as pulse width. Note that the measurements from the two different sensors, while calculated in very different ways are essentially the same verifying that fast, economical, high accuracy pulse measurements can be achieved using statistical methods.

Figure 7 – Pulse Profiling Display

Compact USB Power Sensors offer a variety of measurements including advanced analytical information. Using USB Power sensors also offers several distinct advantages over traditional Power Meter plus sensing Head technology. The small sensors are easily built into ATE equipment, use little power and they offer equal or greater accuracy. ATE system builders may benefit from Statistical Pulse measurements, which can provide easy to setup numeric measurements and can often eliminate the need for graphical analysis in manufacturing.